Content
After the measurement the data is combined locally at the International Masterclasses at each venue. Therefore, you'll enter your measurement results into a list (XLSX) on the spot. All 1000 ATLAS events can be taken into account in this way.
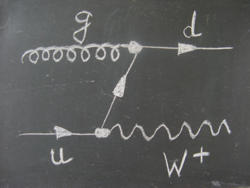
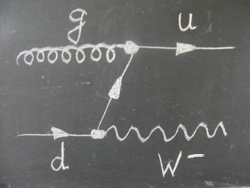
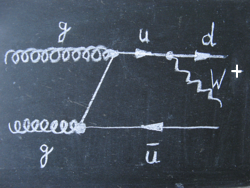
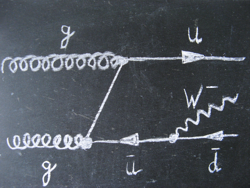
Theory predicts that the various processes should have the following proportions in the production of W particles:
| process | Feynman diagram | proportion |
|---|---|---|
| gluon quark interaction |   |
66% |
| gluon gluon interaction |   |
34% |
- Calculate from the measurement of R± how many times more W+ than W- particles were produced in
quark gluon interaction.
Hint 1: W+ and W- particles are produced at nearly the same rate in gluon gluon interaction.
Hint 2: 66% of all W particles are produced in quark gluon interactions whereas 34% of them are produced in gluon gluon interactions.
- What do you conclude from your result about the structure of the proton?
Do you need help with the analysis? Then follow the information given by this site.
A video conference takes place at the end of the International Masterclasses day, in which you will meet students from other cities and countries who have also analysed ATLAS (or CMS) data. You can compare their results with yours. To do this, please follow the link and enter the results at the appropriate date (worksheets in the table) and venue of the event.