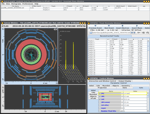
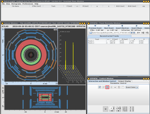
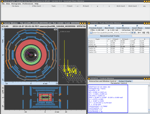
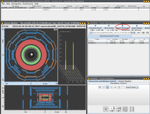
The event display HYPATIA
The electronic signals that are recorded by the detectors during a collision can be transformed into
event displays. To visualize these, we use the program HYPATIA. Before you can work with this program
you should learn which possibilities and functions it has that are important for our analysis.
First, start the program HYPATIA (If you are a participant of the International Masterclasses you can probably start the
program from your PC's desktop directly. Otherwise you should firstly download the program here, unzip it secondly and
finally start it.)
Use the following gallery to get some insight into the functions of the HYPATIA program! Try these settings inside the program in parallel.
-
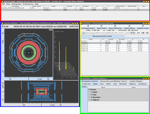
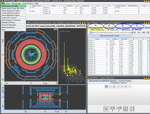
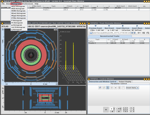
 This picture shows the start view of the event display program HYPATIA with the four windows "Invariant Mass Window" (red frame),
the "Canvas Window" (blue frame), the "Track Momentum Window" (yellow frame) and the "Control Window" (green frame).
The "Invariant Mass Window" shows the invariant mass of your selected tracks, the "Canvas Window" provides different visual
detector views of the event, the "Track Control Window" displays all the information about the tracks in the detector,
and finally the "Control Window" lets you adjust the visual display of the event.
-
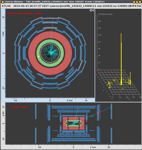
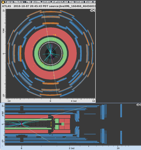
 This picture shows the "Canvas Window". It visualizes the event. It is not shown as
three-dimensional but rather displayed as two-dimensional projections. In the upper part, one can see the detector view
with the view along the beam axis – the so-called cross-sectional view - and below, there is the view from the side – the so-called
side view. Every event has a title that can be read at the very top of the window.
-
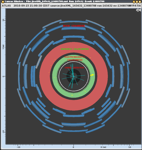
 The different detector shells are illustrated with different colours in the cross-sectional
view as well as in the side view. The inner detector is grey, the electromagnetic calorimeter green, the hadronic calorimeter red,
and the muon chamber is blue.
-
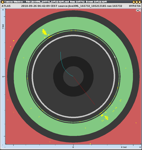
 The paths of electrical charged particles are displayed by coloured tracks in the event display.
They were calculated after the collision took place. The colour of one track is encoded by a relevant physical quantity, the
transverse momentum - the momentum of a particle at right angles to the beam pipe. In this enlarged depiction you can see two tracks,
one red (high transverse momentum) and one blue (low transverse momentum) track.
-
 Connecting energy deposits in the calorimeters to specific tracks in the inner detector is not
always easy. In this event one can see that there isn't a smooth transition from the tracking detectors to the calorimeters.
Energy deposits are displayed as yellow cell entries in both the electromagnetic and the hadronic calorimeters.
-
 Besides neutrinos that traverse the whole detector without being noticed,
muons are the only particles that can make it from the collision point to the
outer detector area. They are detected within the muon chambers (displayed blue). If a muon hits a chamber this chamber is marked as orange.
Two comments: 1. Due to projections of the detector one can see a whole muon detector's element marked as orange in end view while
in side view almost only dots are displayed in orange. 2. Some of the hits on the outer muon chambers are due to particles
moving in the cavern. Most of these originate from collisions
of the beam particles outside the detector producing neutrons
and other particles, and can be ignored. Muons from collisions at the center of the
detector generaly produce hits in ALL the muon layers.
-
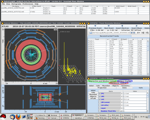
 You will use the "Track Momenta Window" to load files into the program (via File – Read Event Locally;
green frame).
The packed file to be read consists of several files each of
which has saved one event. By selecting the Previous or Next arrows in the upper right menu (brown ellipse), you can move back to
the previous event or advance to the next event. You also use the Track Momenta Window to insert a selected track into the Invariant
Mass Table (see blue ellipse). The missing energy is displayed on the top of the window, see yellow ellipse.
-
 This is your main control for visualizing the events. The window has 3 tabs. With "Parameter Control"
(red ellipse) you can turn on and off objects shown, and for instance change their colours. But most importantly you can choose
filter-thresholds for the information shown. (Will be shown later). The "Interaction and Window Control" (green ellipse) lets you for
instance go from zoom to pick-mode and allows you to switch between projection frames. The "Output Display" (blue ellipse) shows
detailed information about an object you have selected with the pick tool.
-
 By clicking on the "Parameter Control Tab", and then the "Cuts Tab", you can define special selection
criteria for the particles of an event shown in the event display via the "Cuts Tab".
-
 Try to zoom in and out, and pick tracks by changing from the zoom-feature (red ellipse)
to the finger-pick-feature (yellow ellipse).
-
 There is a lot going on in this event. You can see many tracks. Not all of them are
interesting. Particles with high transverse momentum (momentum of a particle that is at right angles (perpendicular)
to the beam pipe) are of interest, and we can supress the low momentum particles by increasing the cut value in the "Cuts Tab".
-
 Use the "Control Window", under the "Cuts Tab" card to show only particles with transverse momenta
above a specified value in the event display. Enter a value for this transverse momentum in the input field (yellow frame: Try
it with 5 GeV!) and confirm it via the enter key. Also make sure that the little box left beside the input field is ticked. Go
to the next picture in order to see the result of that setting.
-
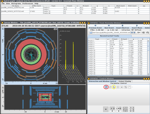
 Now the event display looks much clearer. In order to get information about the remaining particles you can
use the finger pick symbol from the tool bar (red frame). By clicking on one particle track not only the colour changes. Also
detailed data is displayed inside the information box under the "Output Display Tab". You will find it in the next picture.
-
 Pay attention to the blue frame with information about the chosen particle.
-
 By first picking a track with the hand tool and then clicking "Insert Track" (red ellipse),
the chosen track will show up in the "Invariant Mass Table". The selected track will also be highlighted in the "Track Momentum
Window". If you choose two tracks from the event, and insert them both into the table, HYPATIA automatically calculates the
invariant mass of the two particles.
-
 HYPATIA features it's own histograms. Select "Histograms" (red ellipse) in the menu of the
"Invariant Mass Table", and select the desired histogram.
Go ahead and explore. There are many more features!
