Example
This example might help you to analyse your results.
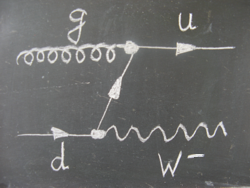
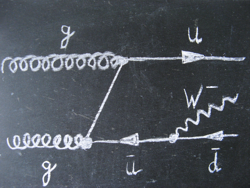
The following table shows you the most important W production processes that may take place.
The W production processes of quark gluon interactions are displayed in the first row and those of gluon gluon interactions in the second row.
Processes in which a W+ particle can be produced are shown in the first column whereas the second column contains the processes of W- production.
Now, we'll add information given by the theory and the example of one measurement to that table in order to calculate individual contributions of the processes that produce W particles.
From theory (see hint 1) we know, that 66% of the W particles are produced in quark gluon interactions and 34% in gluon gluon interactions. We also stipulate one possible result of the measurement: 55% W+, 45% W-:
Theoretical predictions (see hint 2) help us to calculate the contributions of the individual gluon gluon interactions since both processes happen with the same rate:
The last two missing proportions can now be easily calculated by building the sum of both columns:
For the chosen example the ratio of W+ to W- (both produced in quark gluon interactions) is 38:28, or simply 1.4.
| Interaction process | W+ | W- |
|---|---|---|
| Quark gluon interaction | 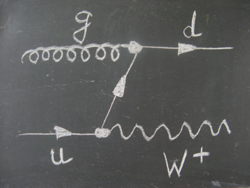 |
 |
| Gluon gluon interaction | 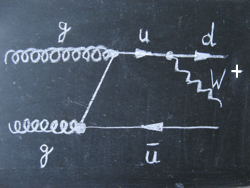 |
 |
Now, we'll add information given by the theory and the example of one measurement to that table in order to calculate individual contributions of the processes that produce W particles.
From theory (see hint 1) we know, that 66% of the W particles are produced in quark gluon interactions and 34% in gluon gluon interactions. We also stipulate one possible result of the measurement: 55% W+, 45% W-:
| Interaction process | W+ | W- | theory |
|---|---|---|---|
| Quark gluon interaction | |
|
66% |
| Gluon gluon interaction | |
|
34% |
| measurement | 55% | 45% | 100% |
Theoretical predictions (see hint 2) help us to calculate the contributions of the individual gluon gluon interactions since both processes happen with the same rate:
| Interaction process | W+ | W- | theory |
|---|---|---|---|
| Quark gluon interaction | |
|
66% |
| Gluon gluon interaction | : 17% |
: 17% |
34% |
| measurement | 55% | 45% | 100% |
The last two missing proportions can now be easily calculated by building the sum of both columns:
| Interaction process | W+ | W- | theory |
|---|---|---|---|
| Quark gluon interaction | : 38% |
: 28% |
66% |
| Gluon gluon interaction | : 17% |
: 17% |
34% |
| measurement | 55% | 45% | 100% |
For the chosen example the ratio of W+ to W- (both produced in quark gluon interactions) is 38:28, or simply 1.4.
Click here get back to the analysis site.