The following picture gallery contains the information about Feynman diagrams necessary to understand the explanations on the following pages. This information uses the muon as an example. The muon is a popular particle among physicists, although unknown to most human beings. It is produced in collisions of cosmic particles with the atoms of the atmosphere and flies through our body on its way down. At sea level one can measure about one muon per minute within an area the size of a finger nail. (How many muons cross your body within a year?)


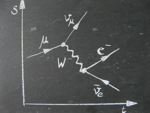
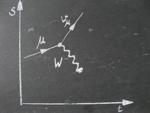
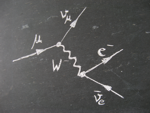
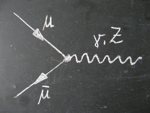
The 3 images on the left illustrate the sequence of the decay of the muon, and the last image depicts a muon-antimuon annihilation.


  • These cosmic ray muons have a lifetime of 1/500 of a millisecond before they decay. In this picture you can find the Feynman diagram describing the decay of a muon into a W- particle and a muon neutrino. The W- itself decays into an electron and an electron anti-neutrino. You can gather the chronological sequence from the horizontal axis (time, abbreviated with t) in this diagram. The spatial sequence can be gathered from the perpendicular axis (s for space). There are always ingoing particles (here: muon) and outgoing particles (here: neutrinos and electron) inside a Feynman diagram. Leptons are displayed as straight lines with a little arrow in the middle of the line whereas the messenger particles of the weak (W, Z) and electromagnetic (γ) interactions are shown by wavy lines. Anti-leptons are always displayed with an arrow that points backward in time.
  • Interactions are described by vertices (here: red coloured). They also mark places where charge, momentum and energy conservation must be valid. The first vertex represents the process that happens earlier. There a W- particle is emitted. This is called emission of a messenger particle.
  • The second vertex shows the creation of particles. Here, the W particle is transformed into an electron and an electron anti-neutrino.
  • And what if by chance a muon hits an anti-muon during its flight through the earth's atmosphere? They annihilate each other creating either a photon or a Z particle. This process is aptly called annihilation.


As a matter of fact, Feynman diagrams (proposed and developed by Richard Feynman – Nobel Prize in Physics 1965), are depictions of decays and interactions between particles, with a proper mathematical treatment described by quantum field theory. Using these pictures, complicated processes can be illustrated and occurrence probabilities can be computed more easily.

Here you get back to the beta decay website.
Here you get back to the W particle website.